
Industrial AI for plant operations
Industrial AI that shows its work.
Crucion watches the meters and equipment across your plant, finds the problems that cost money, prices each one from your own utility rates, and explains it in plain language with the evidence on the page.
The problem
Your plant is instrumented. It still doesn't tell you what to fix.
Data without answers
Historians and meters collect millions of readings. Someone still has to work out what they mean and what they cost.
Weeks to diagnose
Finding the cause of a demand spike or a falling power factor pulls engineers away from the work they were hired to do.
Savings that come back
An audit finds savings once. Leaks return, setpoints drift and the report sits on a shelf. Waste needs continuous attention.
How it works
Engineering first. AI second.
Engineering evaluators compute every number. AI explains what they found. That order is why the answers hold up.
Any vendor's meters and devices over OPC UA (direct or through your existing OPC server), Modbus TCP, device web services, SNMP v3 and direct APIs, plus the logs and diagnostics stored inside the devices themselves. Electricity, compressed air, water, gas and steam.
Deterministic evaluators built on U.S. Department of Energy methodology detect events and price them from your own rate schedule. The same data gives the same finding every time. Your team records a verdict on each one: act, discuss, investigate, watch or dismiss.
A morning briefing for the site, answers to questions about any event, and full written investigations. The AI works only from evaluated findings, so it explains the evidence rather than inventing it.
The engineering underneath
Fifty years of public engineering behind every number.
Crucion's evaluators are built on methods developed through decades of U.S. Department of Energy and national laboratory research, and proven in real plants. Crucion runs that engineering continuously on your live data, so every number traces back to published methodology, not to an AI.
-
Decades Plant assessments Engineers measure real compressed air, steam, motor and electrical systems in operating plants.
-
Research National laboratory methods The findings become published calculation methods for each type of system.
-
Practice Used by manufacturers Plants across the country use those methods to set goals and verify savings.
-
Crucion Running continuously The same engineering, applied to your live data every day and priced from your rates.
What you see each morning
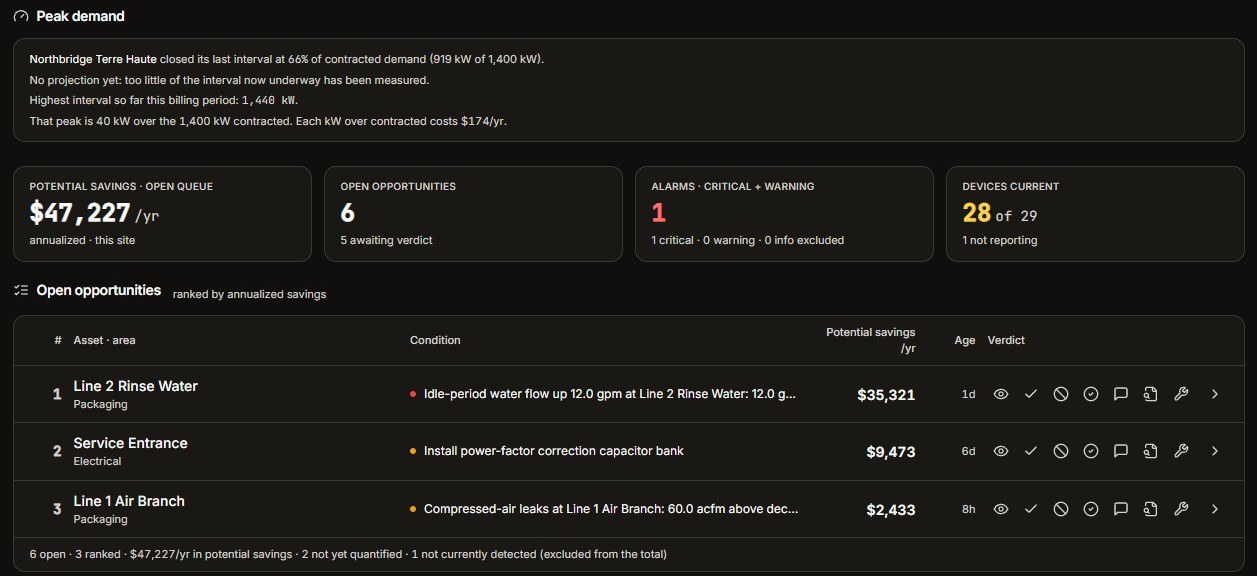
A ranked list of what to fix, in dollars.
Peak demand against your contracted limit, then every open finding ranked by its value to your plant and priced from your own tariff, with the condition behind it one click away. Water, compressed air, power factor, demand and more.
Human in the loop
Crucion finds it. Your team decides.
Crucion keeps a human in the loop. It never acts on your plant by itself: every finding waits for someone who knows the equipment to decide what to do. Those decisions, along with your team's work orders and their conversations with CrucionAI, become part of what Crucion knows about your plant, and it draws on them the next time a similar problem appears. What your experienced people know stays with the plant when they retire.
- Act Real and worth fixing. It moves to the work plan.
- Discuss Worth a conversation with operations, maintenance or finance first.
- Investigate Needs a closer look. Run a full investigation of the evidence.
- Watch Not yet. Crucion keeps watching and brings it back with new evidence.
- Dismiss Known or expected. Recorded, so the same question isn't asked twice.
- Acknowledge Seen and understood. No action now, and it stays on record.
- Resolve Fixed. Closed with a note on what was done.
Deeper data
Data your historian never sees.
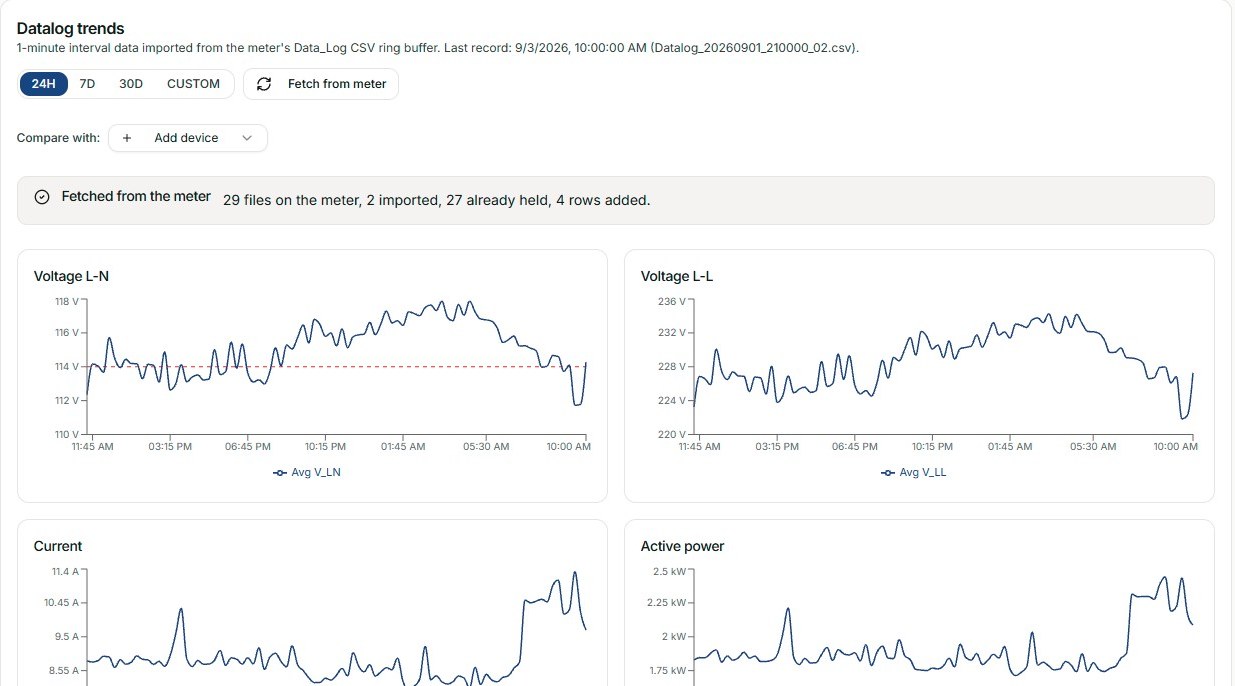
Crucion reads the logs, power quality events and diagnostics stored inside your meters. When the network drops, Crucion recovers up to 90 days of missed interval data from the meter's own onboard log on supported meters, so a gap in the network isn't a gap in your records.
Beyond energy
From the meter to the product.
Electricity, compressed air, water and steam run the equipment, and the equipment makes the product. Crucion measures all three in one place and prices production losses the same way it prices energy, from your own capacity and margin.
Utilities
- Electricity and demand
- Compressed air
- Water
- Natural gas and steam
Equipment
- Compressors and chillers
- Boilers and cooling
- Process lines and fillers
- Panels and switchgear
Production
- First-pass yield
- Equipment effectiveness
- Throughput
- Priced from your margin
So a drop in yield on a coater shows up next to the air, steam and power that coater uses, and a plant meeting about energy becomes a meeting about production.
Production impact
When a line stops, Crucion traces it back to where it started.
A voltage sag trips a compressor, air pressure falls below what the filler needs, and the line stops. Most plants see three events in three systems. Crucion connects them into one production impact event: where it started, how it spread, what production was lost and what it cost, counted once.
One production impact event · illustrative example
Utility voltage sag at 2:14 a.m.
Recorded by the meter on the main service.
ComputedCompressor trips. Air header falls below 85 psi.
Below the filler's declared minimum pressure.
ConfiguredLine 2 filler stops for 38 minutes.
1,520 cases not produced.
Computed$4,864
Lost margin, priced from Line 2's own margin per case.
It can start anywhere.
An incoming utility, a piece of equipment upstream, or the line itself.
Every link is backed by evidence.
Crucion names a cause only when your plant's layout and the measured data agree.
Each loss is counted once.
One event, one cause, one dollar figure, not three reports claiming the same downtime.
AI that shows its work
Every answer comes with its evidence.
Plant teams don't act on answers they can't check. When a finding needs a closer look, Crucion writes a full investigation: the facts and where each came from, the math, the likely causes, what it can't see, and actions in order, with capital spending last.
- →Every fact labeled computed, configured or assumption
- →What it can't observe, listed in every investigation
- →Realistic recovery ranges instead of a single promise
- →Methodology cited; capital actions wait on evidence
- →Runs through your own AI account, sending findings and context, not raw time-series
Coater first-pass yield decline
Estimated recoverable value: $3,300 – $8,250 per yearBuilt for OT and IT
It runs in your plant. Your data stays there.
One appliance, on site
Crucion installs as a virtual appliance validated on VMware vSphere, Stratus ztC Edge, KVM and Hyper-V. Analysis happens inside your plant, not in a vendor cloud.
Your keys, your accounts
Every integration credential, including the AI account, belongs to you and is stored encrypted on the appliance.
Works air-gapped
A site with no outside connection still gets every finding and every dollar figure. Only the AI narrative needs a connection.
Who builds it
Built by Conperio Technology Solutions.
Conperio is an industrial software company in Terre Haute, Indiana, focused on manufacturing. We build software that gets plant data working, and we built Crucion to turn that data into decisions a plant team can trust.
Talk to us
See Crucion on real equipment.
Visit our Customer Experience Center in Terre Haute, Indiana, where Crucion runs on real meters and plant hardware, or start with a conversation. Tell us about your plant and the meters you have, and what you'd most like answered.
sales@conperio.com